UXUI
|
클라이언트
Sije.Intl
기간
2022.10.-2023.02
작업 범위
Product UX / GUI
작업자
Director JANE Designer LOE/WENDY

Overview
모노리스는 AI 공정설계 알고리즘과 빅데이터를 활용한 생산 예측 모듈을 가진 스마트 팩토리 솔루션입니다. 현재 의류 제조업은 공급과 수요의 불균형과 낡아버린 산업 구조로 어려움을 겪고 있습니다. 모노리스는 의류 산업의 지나치게 복잡한 소싱 프로세스를 직관적인 UI로 디지털 전환하여 업무를 효율적으로 만들고, IT기술을 제공하여 미래의 핵심 산업으로 도약시킵니다.
MONOLIS is a smart factory solution with AI process design algorithms and production prediction modules based on bigdata. The apparel industry has not improved for over 50 years due to the imbalance in the supply chain and the outdated industrial structure. MONOLIS solves the imbalance of supply by digitally transforming the complex sourcing process into an intuitive UI and enables efficient work. It will make apparel manufacturing the core industry of our future through IT technology.

‘의류 산업의 디지털 전환’이라는 모노리스의 목표를 담은 MONOLIS Blue 와 MONOLIS Gradient, 모노리스의 전문성을 표현하는 ‘MONOLIS Black’ 을 메인 컬러로 활용합니다.
MONOLIS Blue represents MONOLIS’s goal of ‘digital transformation of the apparel industry.’ MONOLIS Gradient and MONOLIS Black express MONOLIS’s professionality.

연계되어 있는 데이터를 놓치지 않고 많은 양의 데이터를 한눈에 보기 위해 오른쪽에서 왼쪽으로 사이드 페이지가 열리는 구조를 선택했습니다. 화면을 더 효과적으로 사용하기 위해 사이드 페이지가 열릴 시, 왼쪽 네비게이션은 축소됩니다.
To view a large amount of data at once without missing relevant content, side pages open on all pages. When the side page opens, the left navigation downsizes into a simple version for more efficient use of the page.
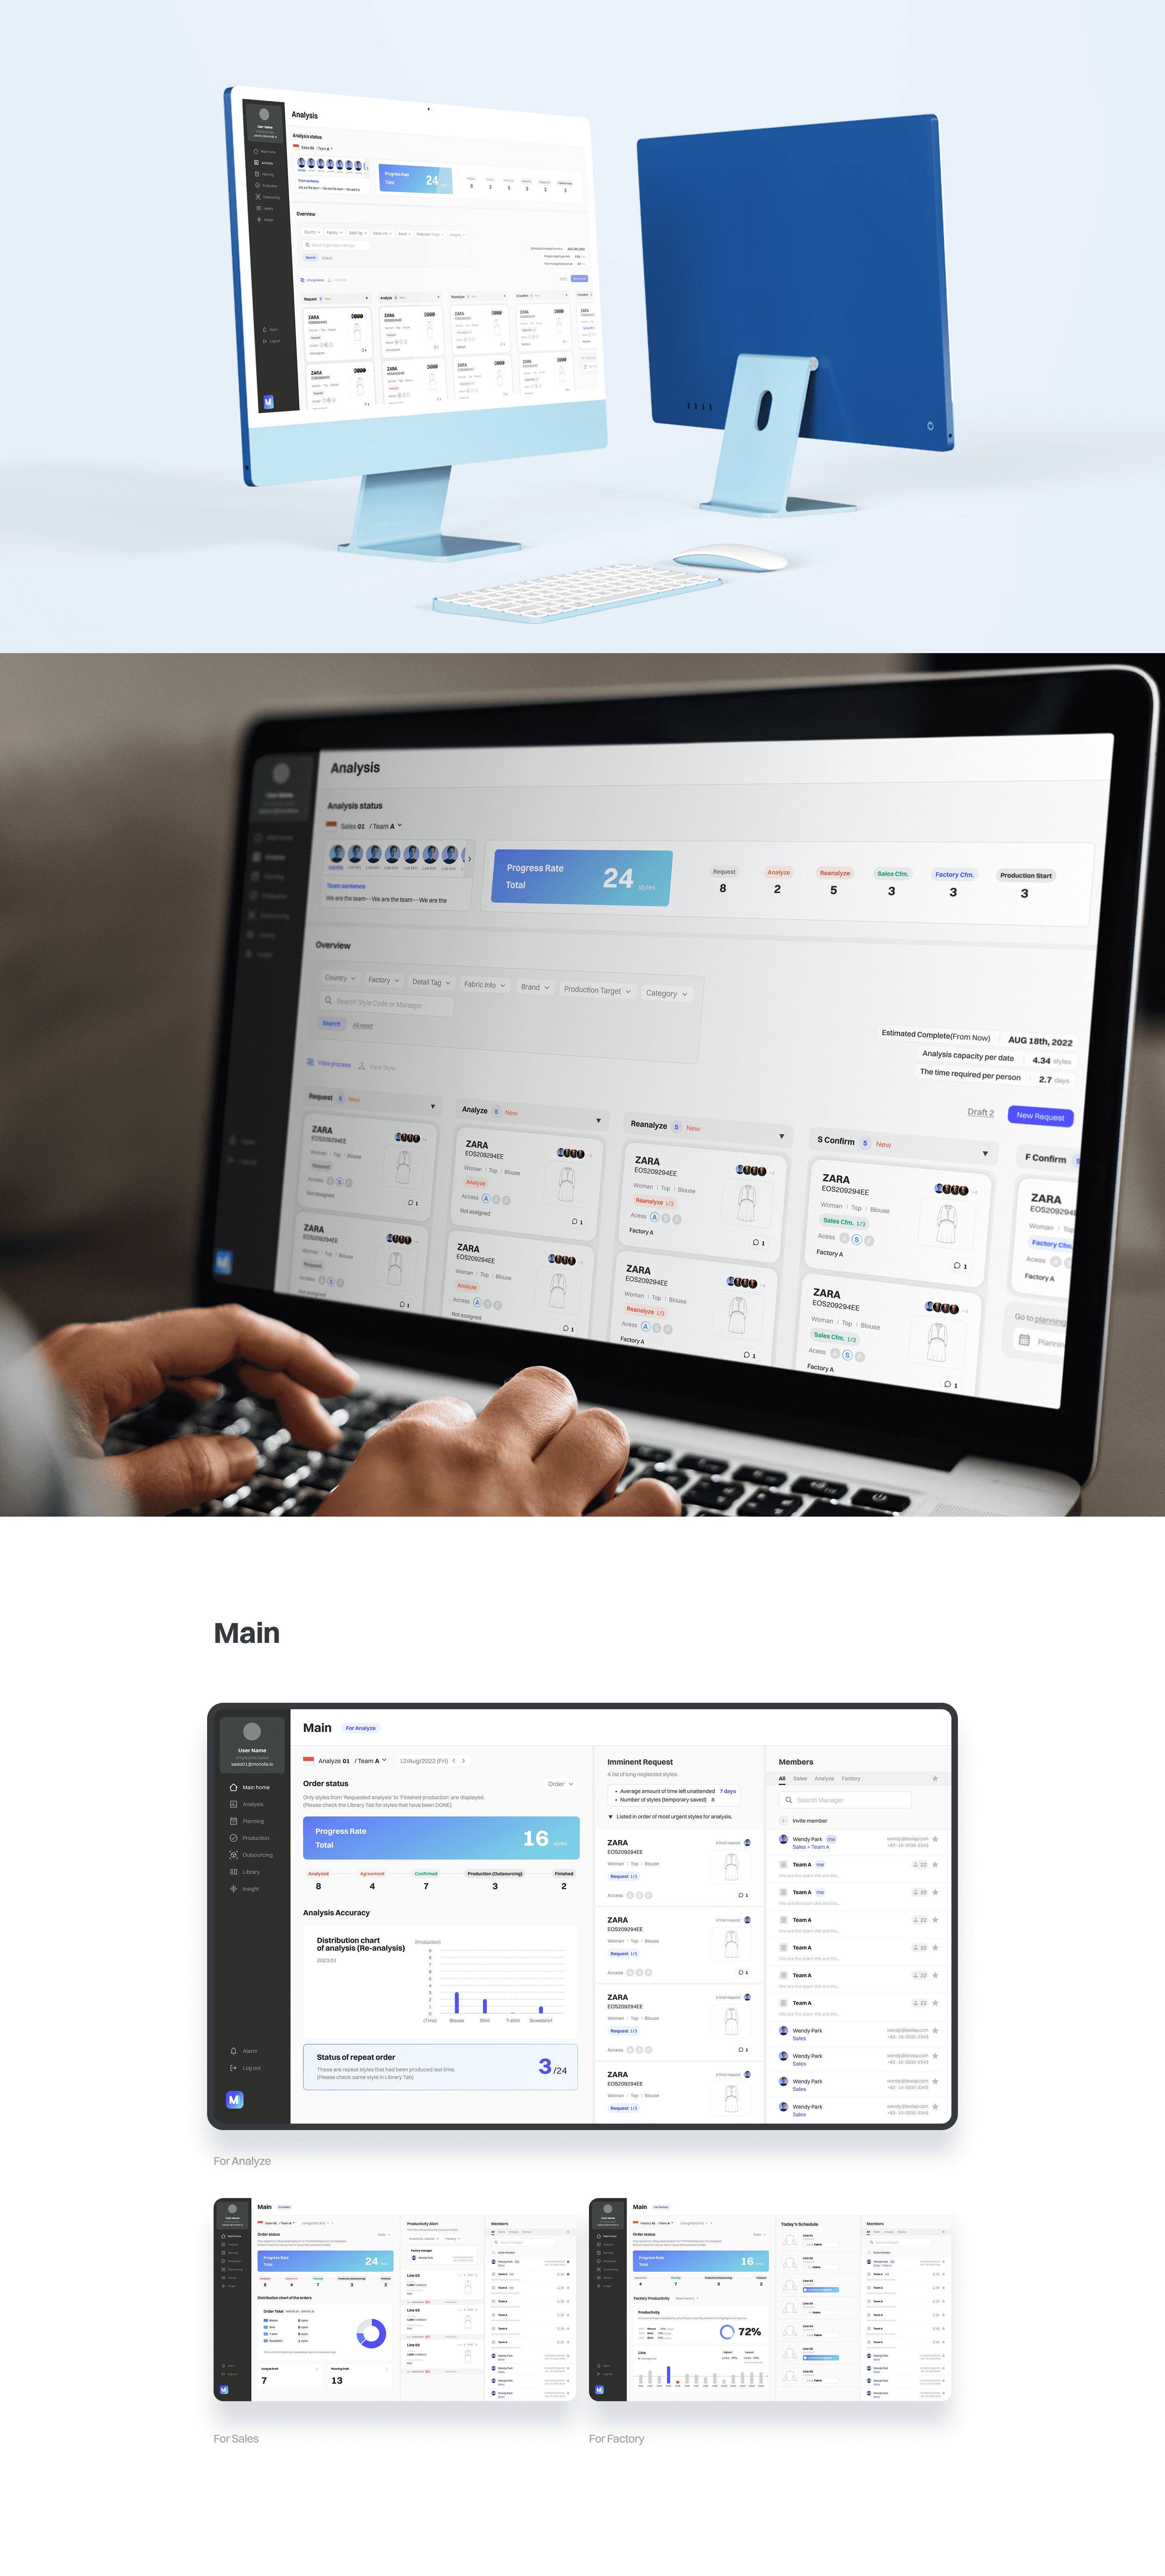
영업, 분석, 공장 각각의 메인 홈을 다르게 구성하여 팀의 중요한 업무를 서비스 첫 화면에서 볼 수 있도록 하였습니다. 페이지 우측에서 모든 팀의 멤버를 확인하고 초대할 수 있습니다.
The Main page for the three teams : Sales, Analysis, and Factory is composed differently so that each team can check their important tasks on the first page. On the right, you can view and invite all team members.
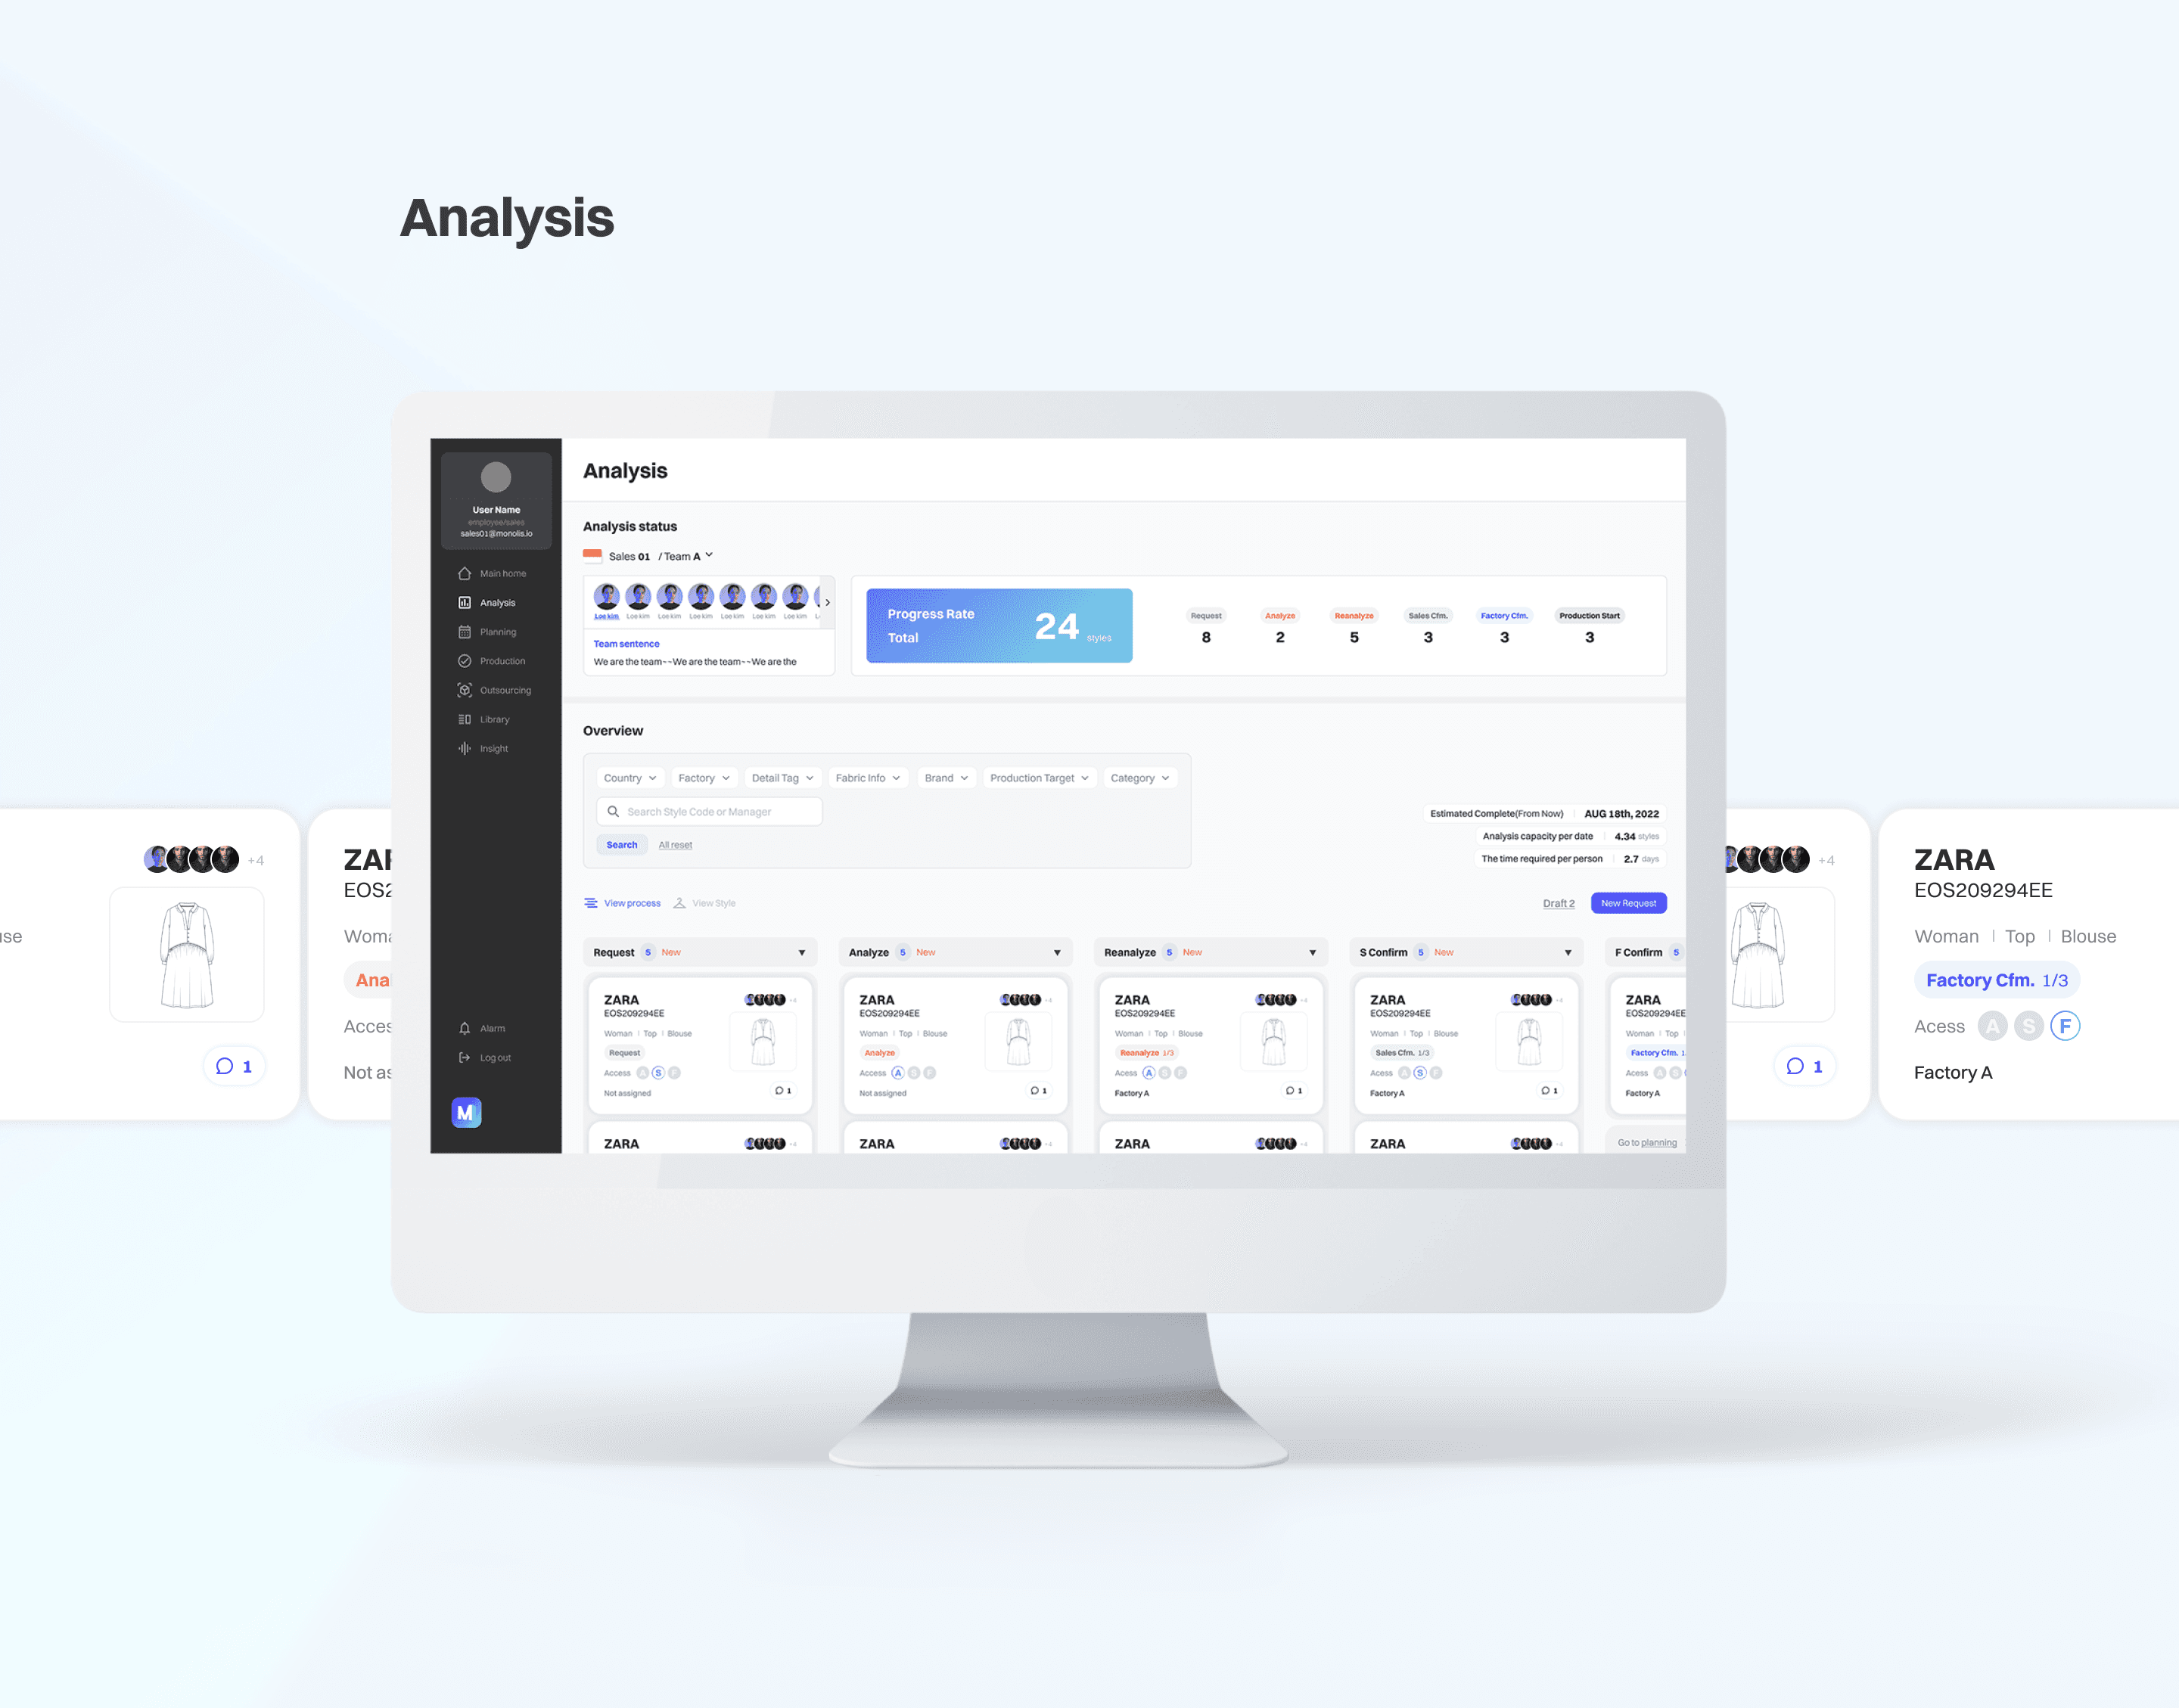
세 팀이 협업하며 합의와 재분석을 반복하는 분석 페이지는 색깔 태그를 이용하여 분석 단계별로 스타일을 나누고, 팀의 이니셜로 각 팀의 업무를 구분하여 표시하였습니다.
On the Analysis page, the three teams collaborate to analyze styles following the process. The analysis process is divided by color tags and each team's tasks are displayed in team initials.
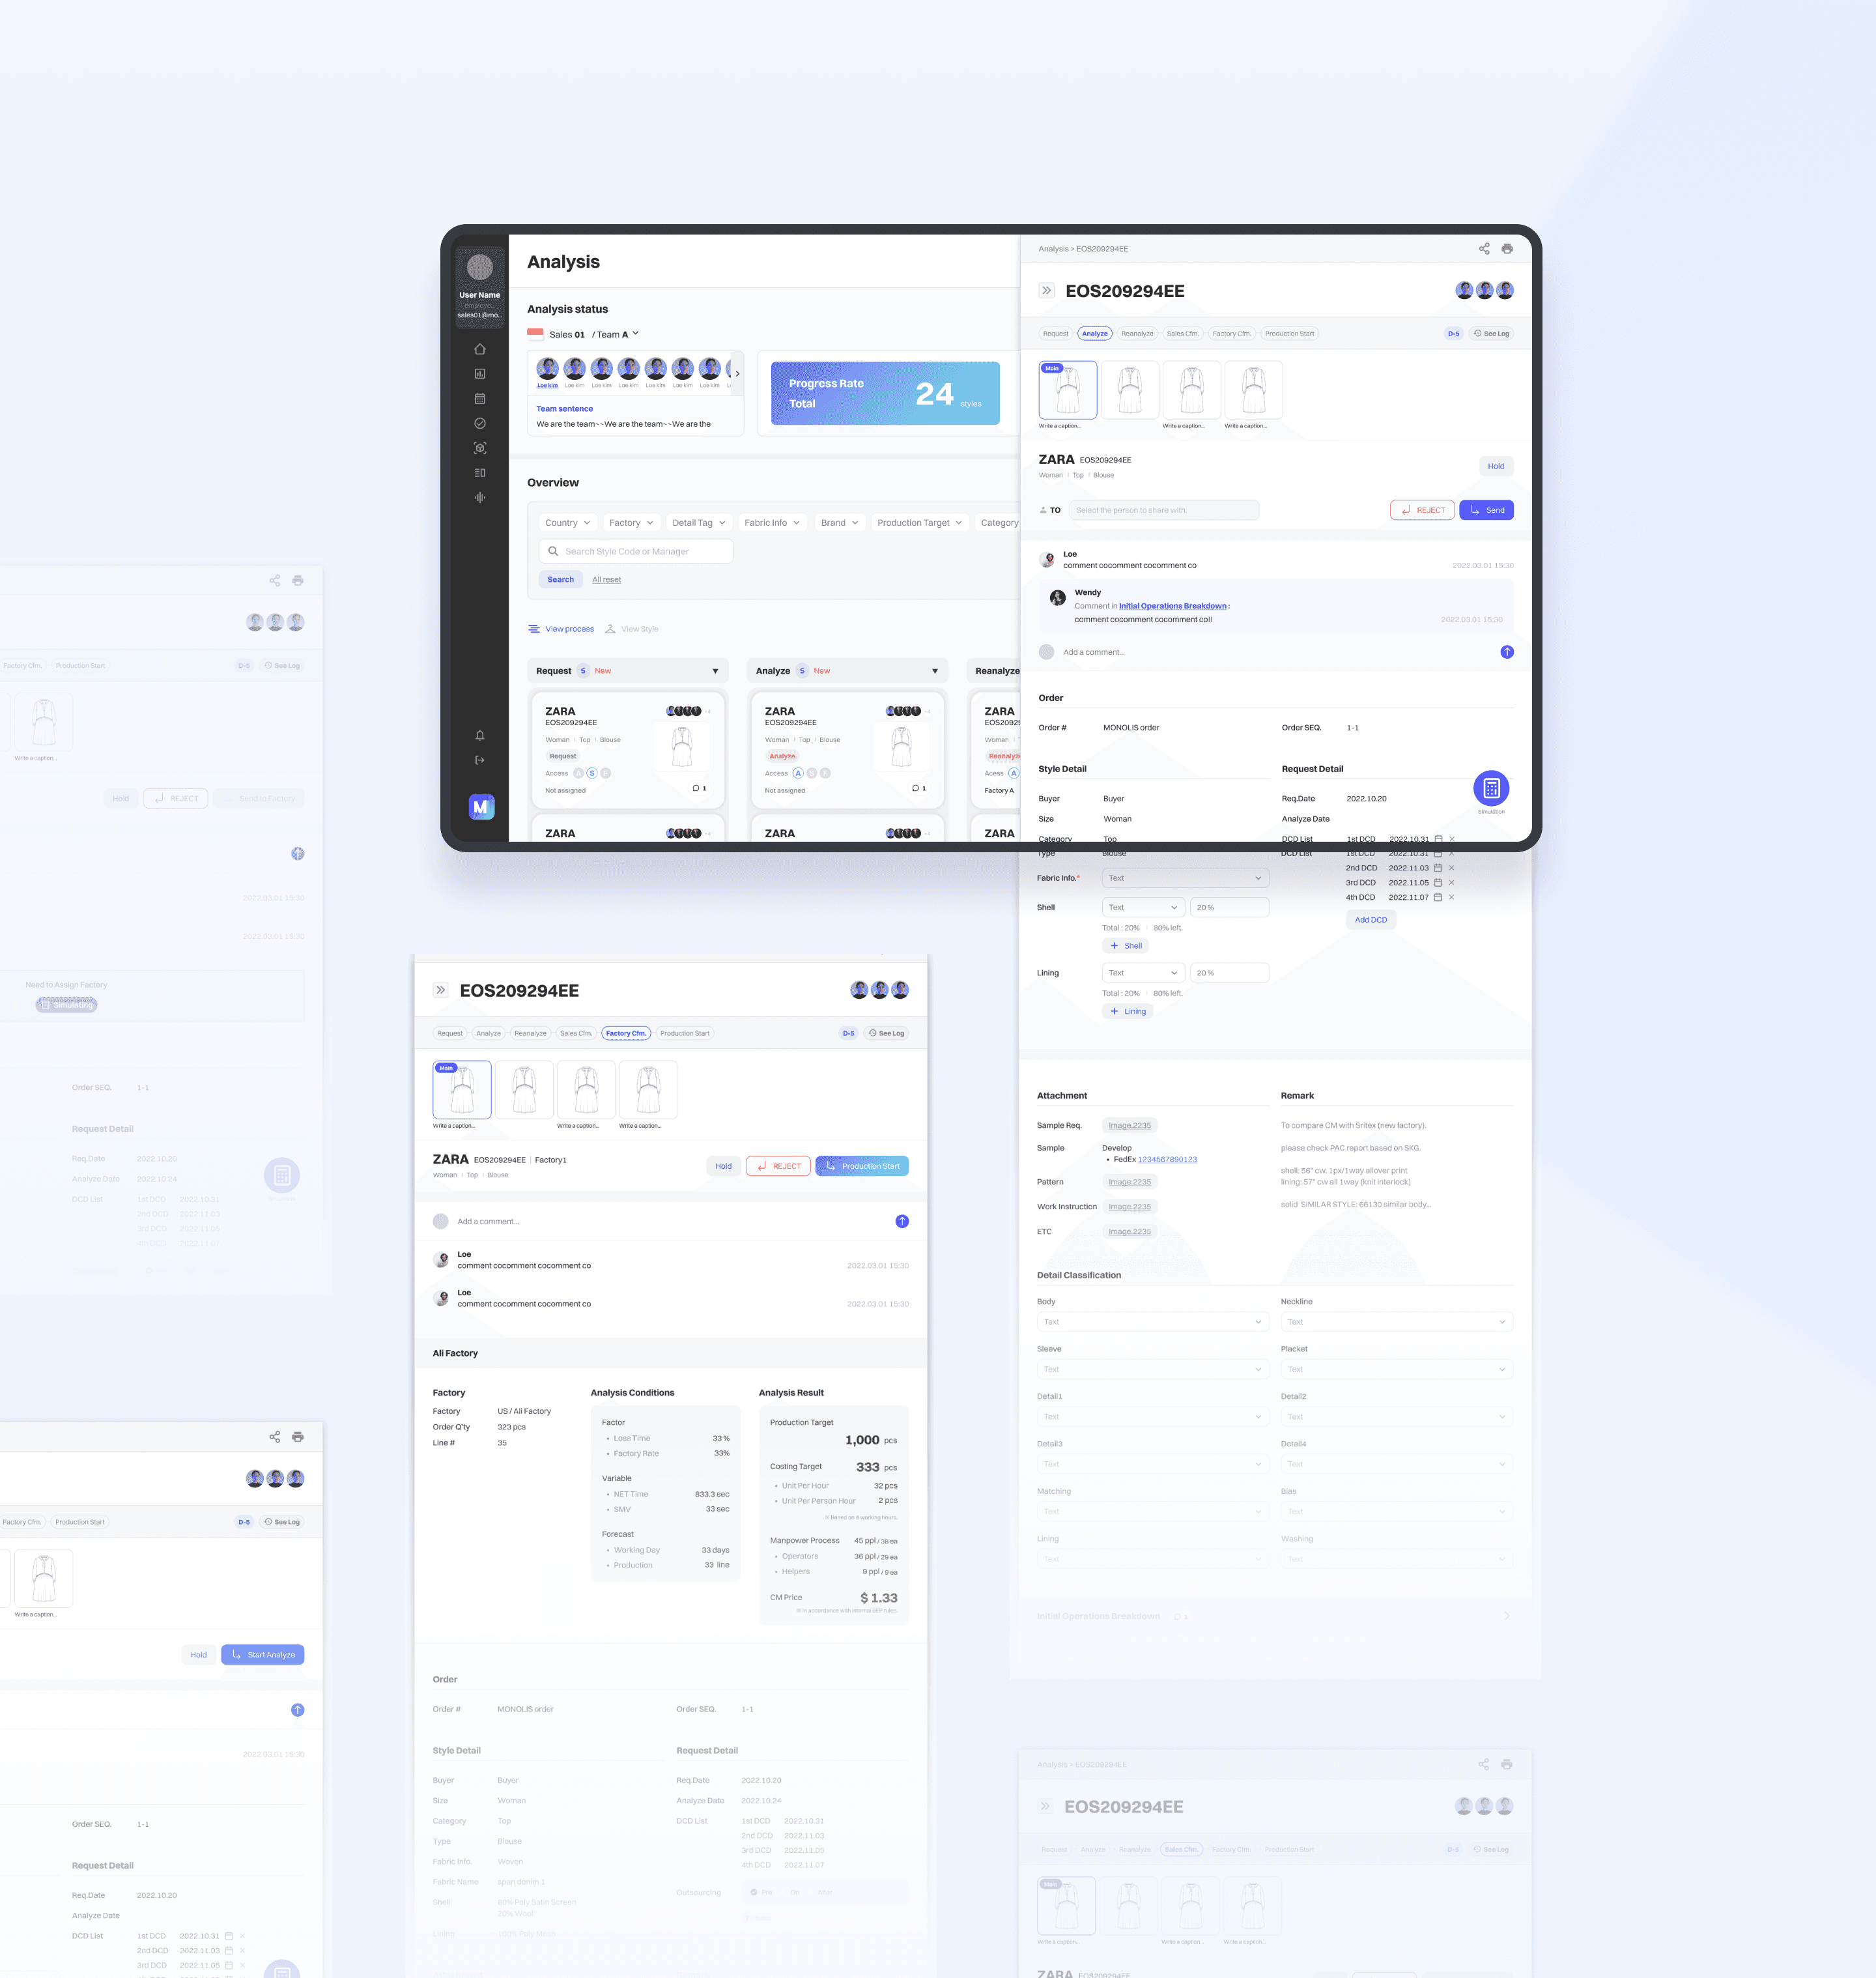
스타일 상세 페이지 상단에서 현재의 공정 분석 단계를 확인 가능하며, 멤버를 태그하여 다음 단계로 넘어가거나 재분석을 의뢰할 수 있습니다.
You can check the current analysis stage at the top bar of the detail page. You can also tag members to move on to the next stage or request re-analysis.
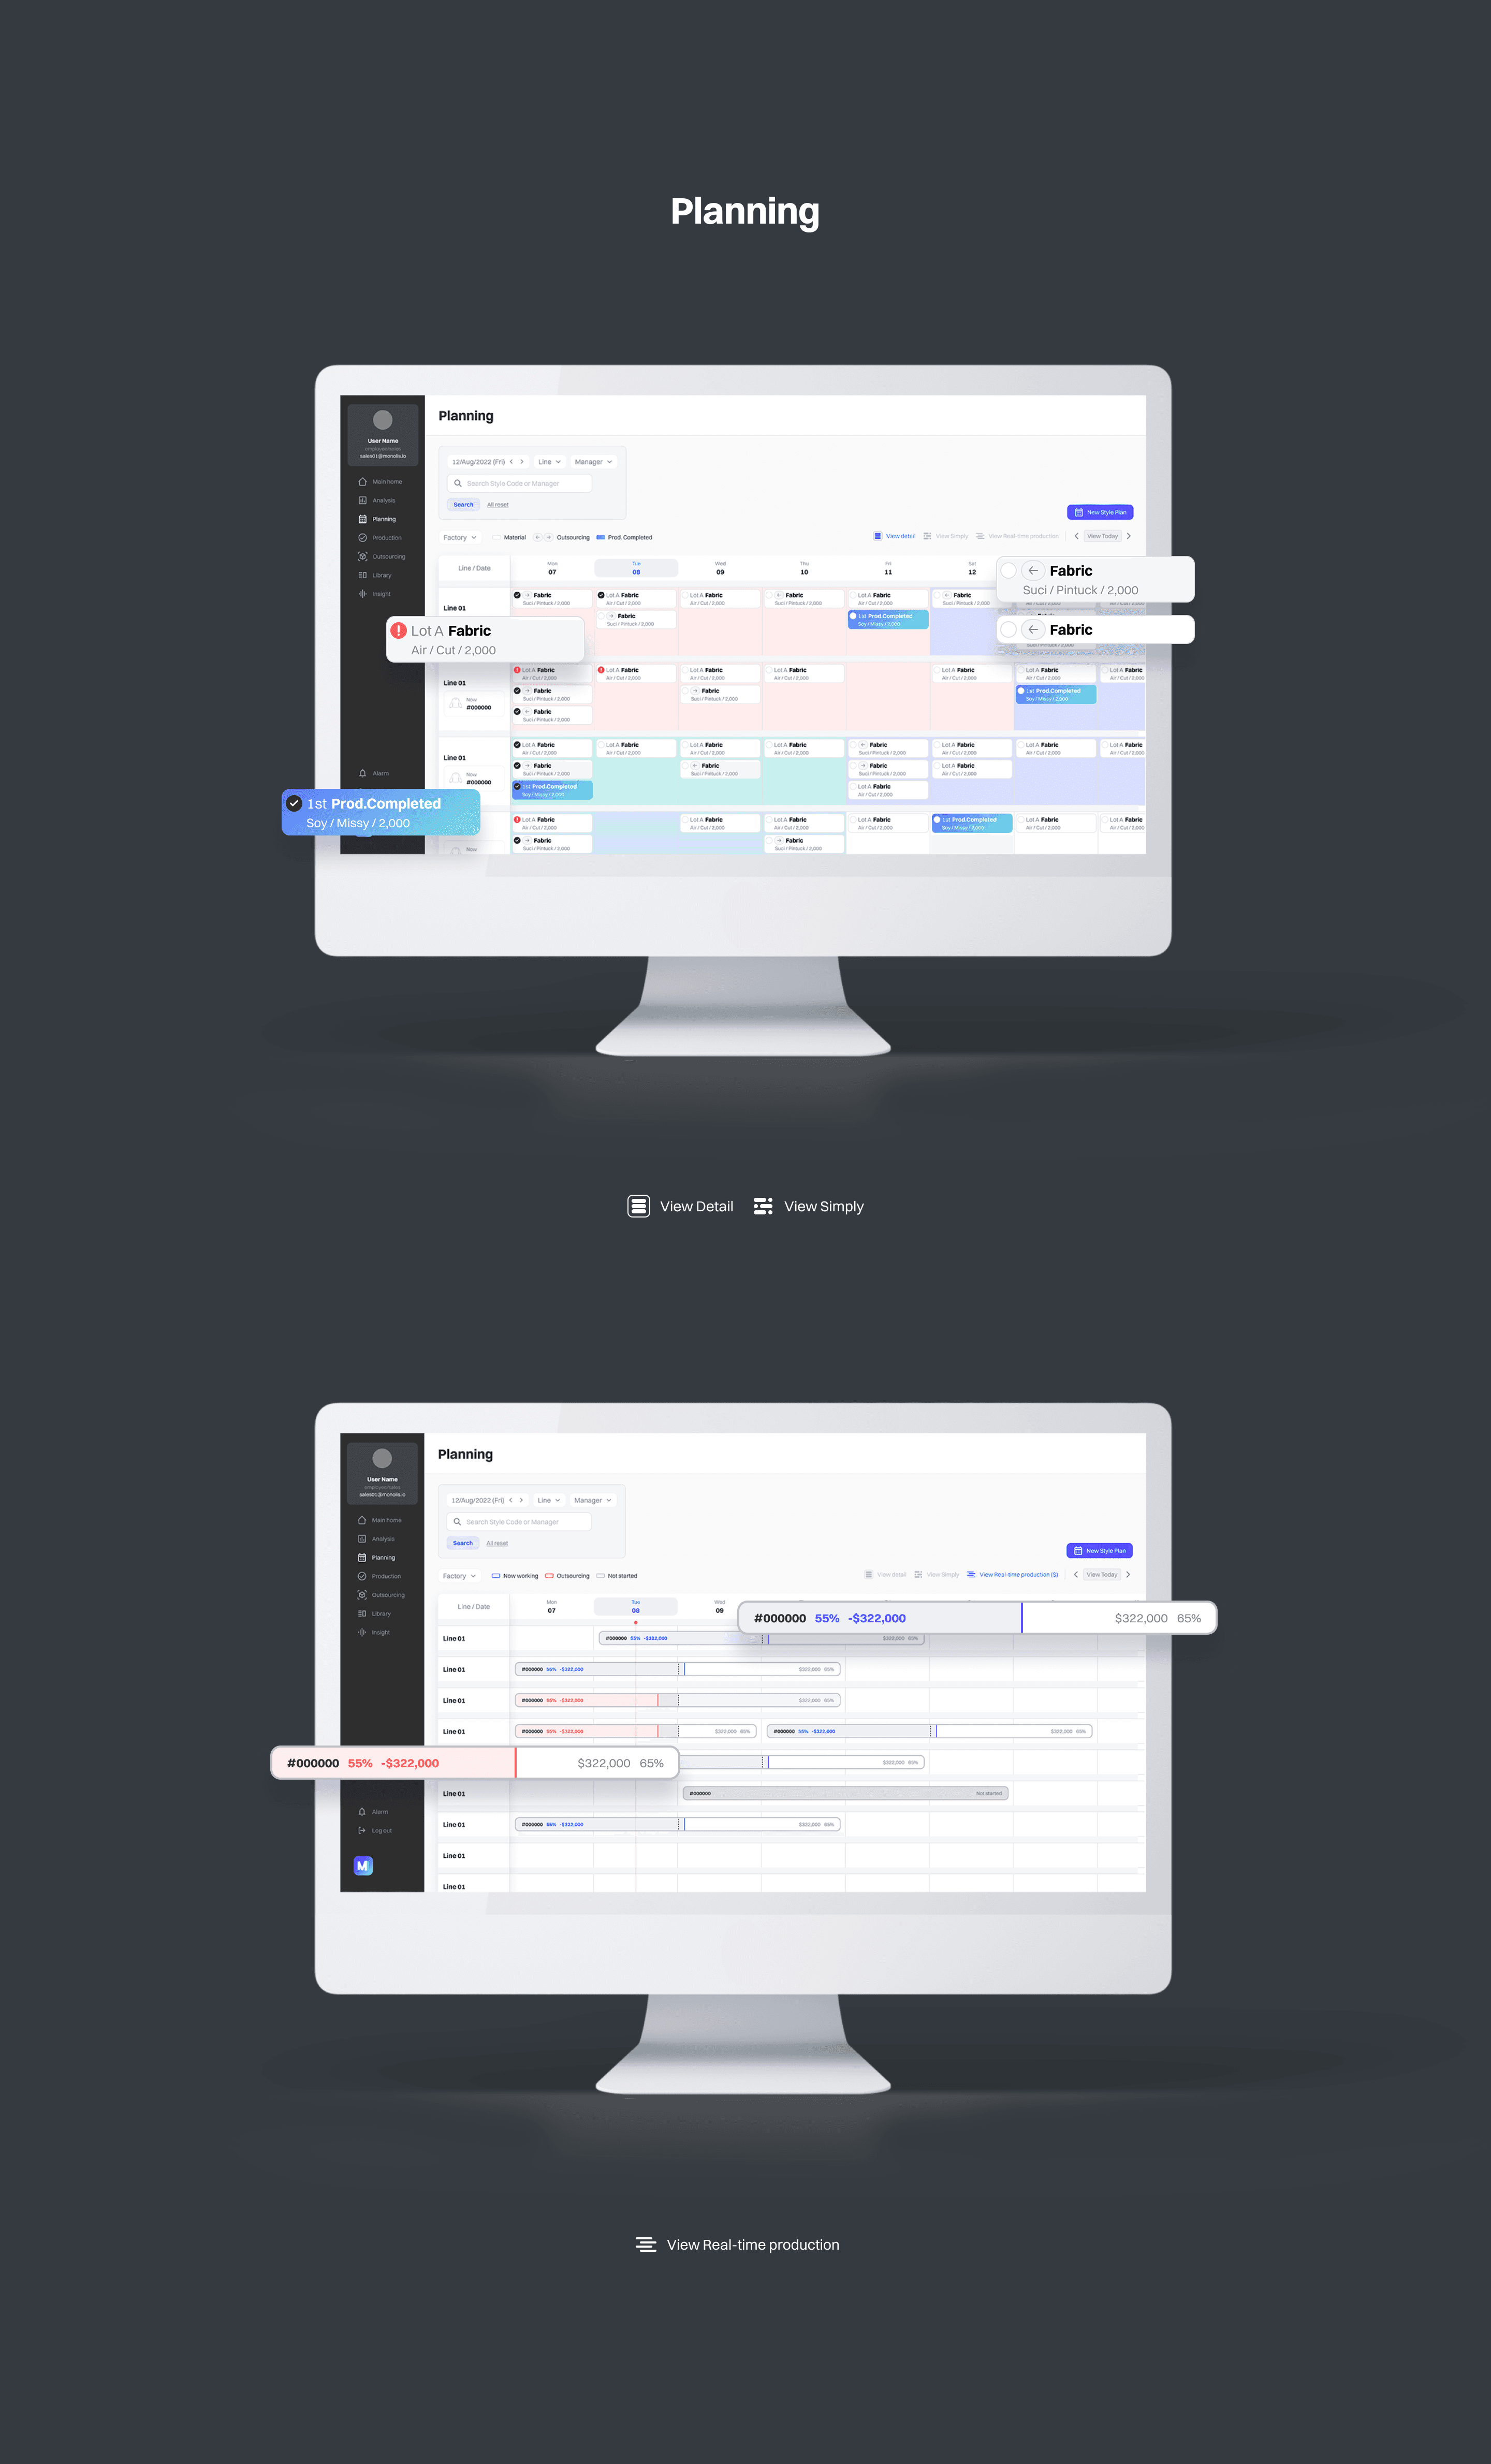
플래닝은 상세한 스케줄과 날짜별 수익성을 보는 페이지를 나누어 다방면으로 효율적인 스케줄 관리가 가능하도록 하였습니다. 플래닝만의 컬러 시스템과 간단화된 썸네일을 통해 라인별 일정을 한눈에 확인할 수 있습니다.
The Planning page allows efficient schedule management in many ways by providing various view approaches, which are ‘View Detail’, ‘View Simply’, ‘ View Real-time production’. Planning's unique color system and simplified thumbnails give you a quick view of the line-by-line schedule.
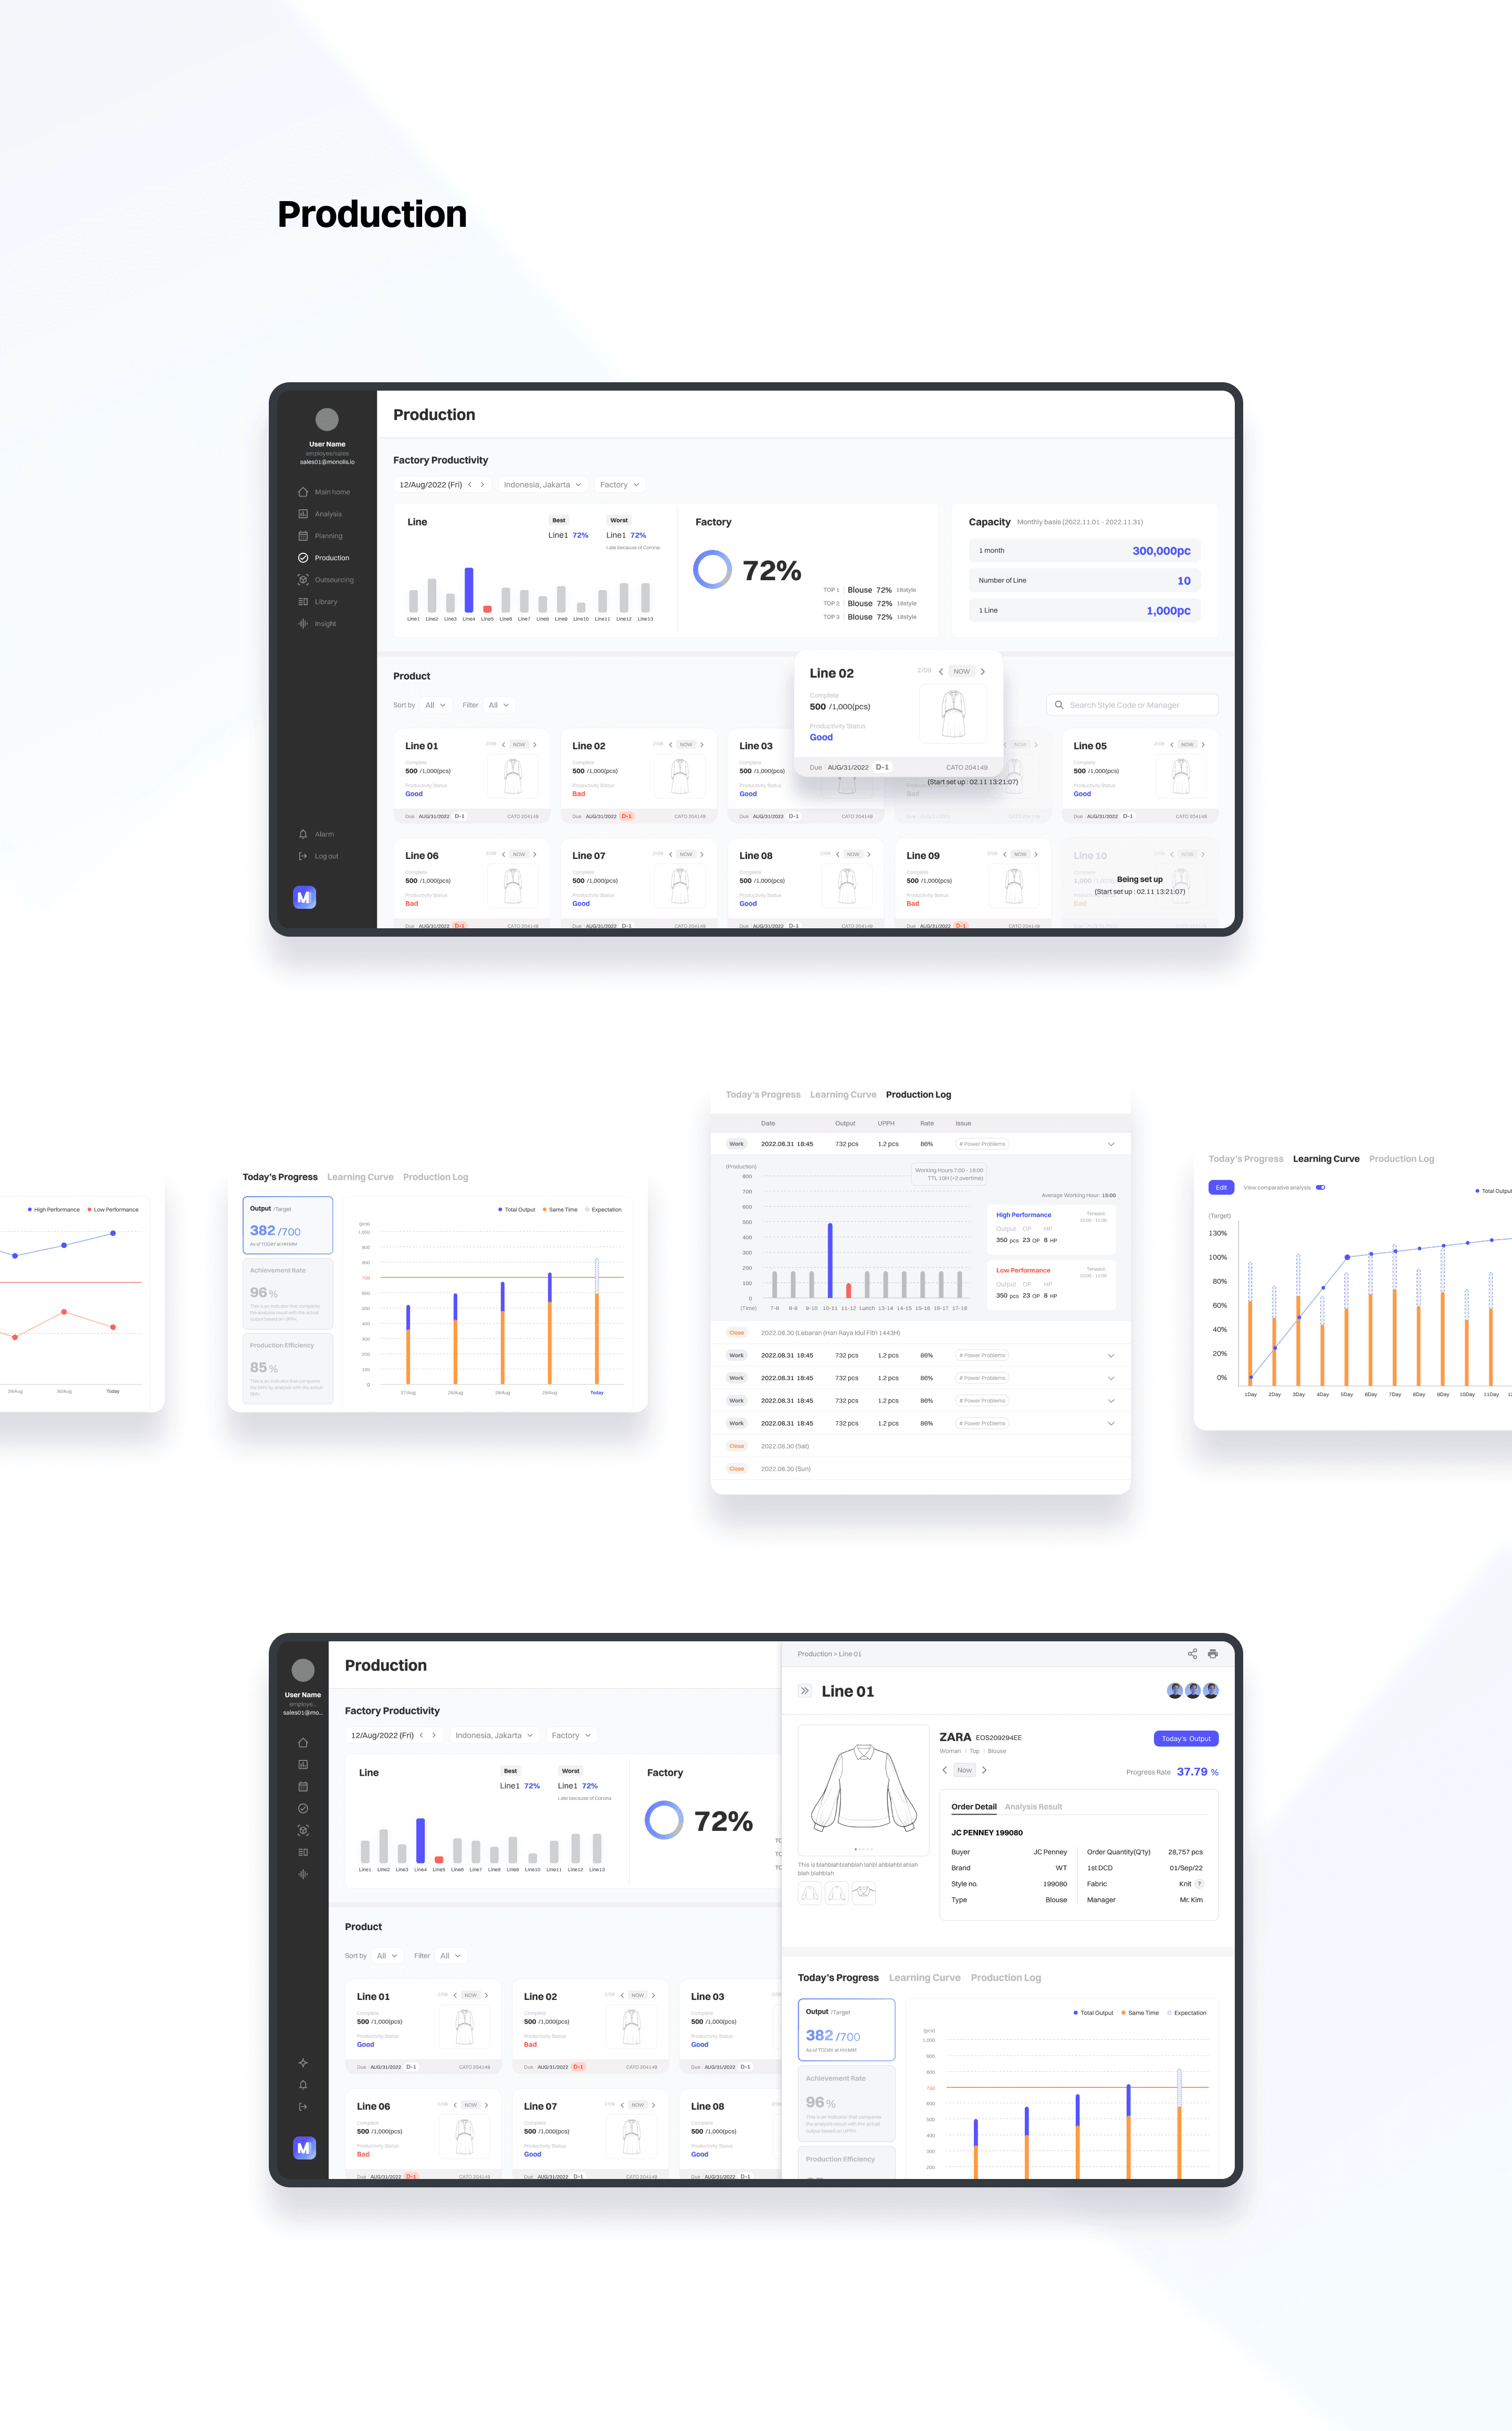
프로덕션 페이지는 공장 라인별로 생산성을 비교하며 확인할 수 있도록 상단 대시보드와 라인 썸네일에 데이터를 보기 쉽게 배치하였습니다. 사이드 페이지에서 다양한 그래프를 통해 생산 상태를 평가할 수 있습니다.
The production page provides an easy-to-see view of data on the top dashboard and line thumbnails for productivity comparison by factory line. On the side page, you can use various graphs to assess production status.
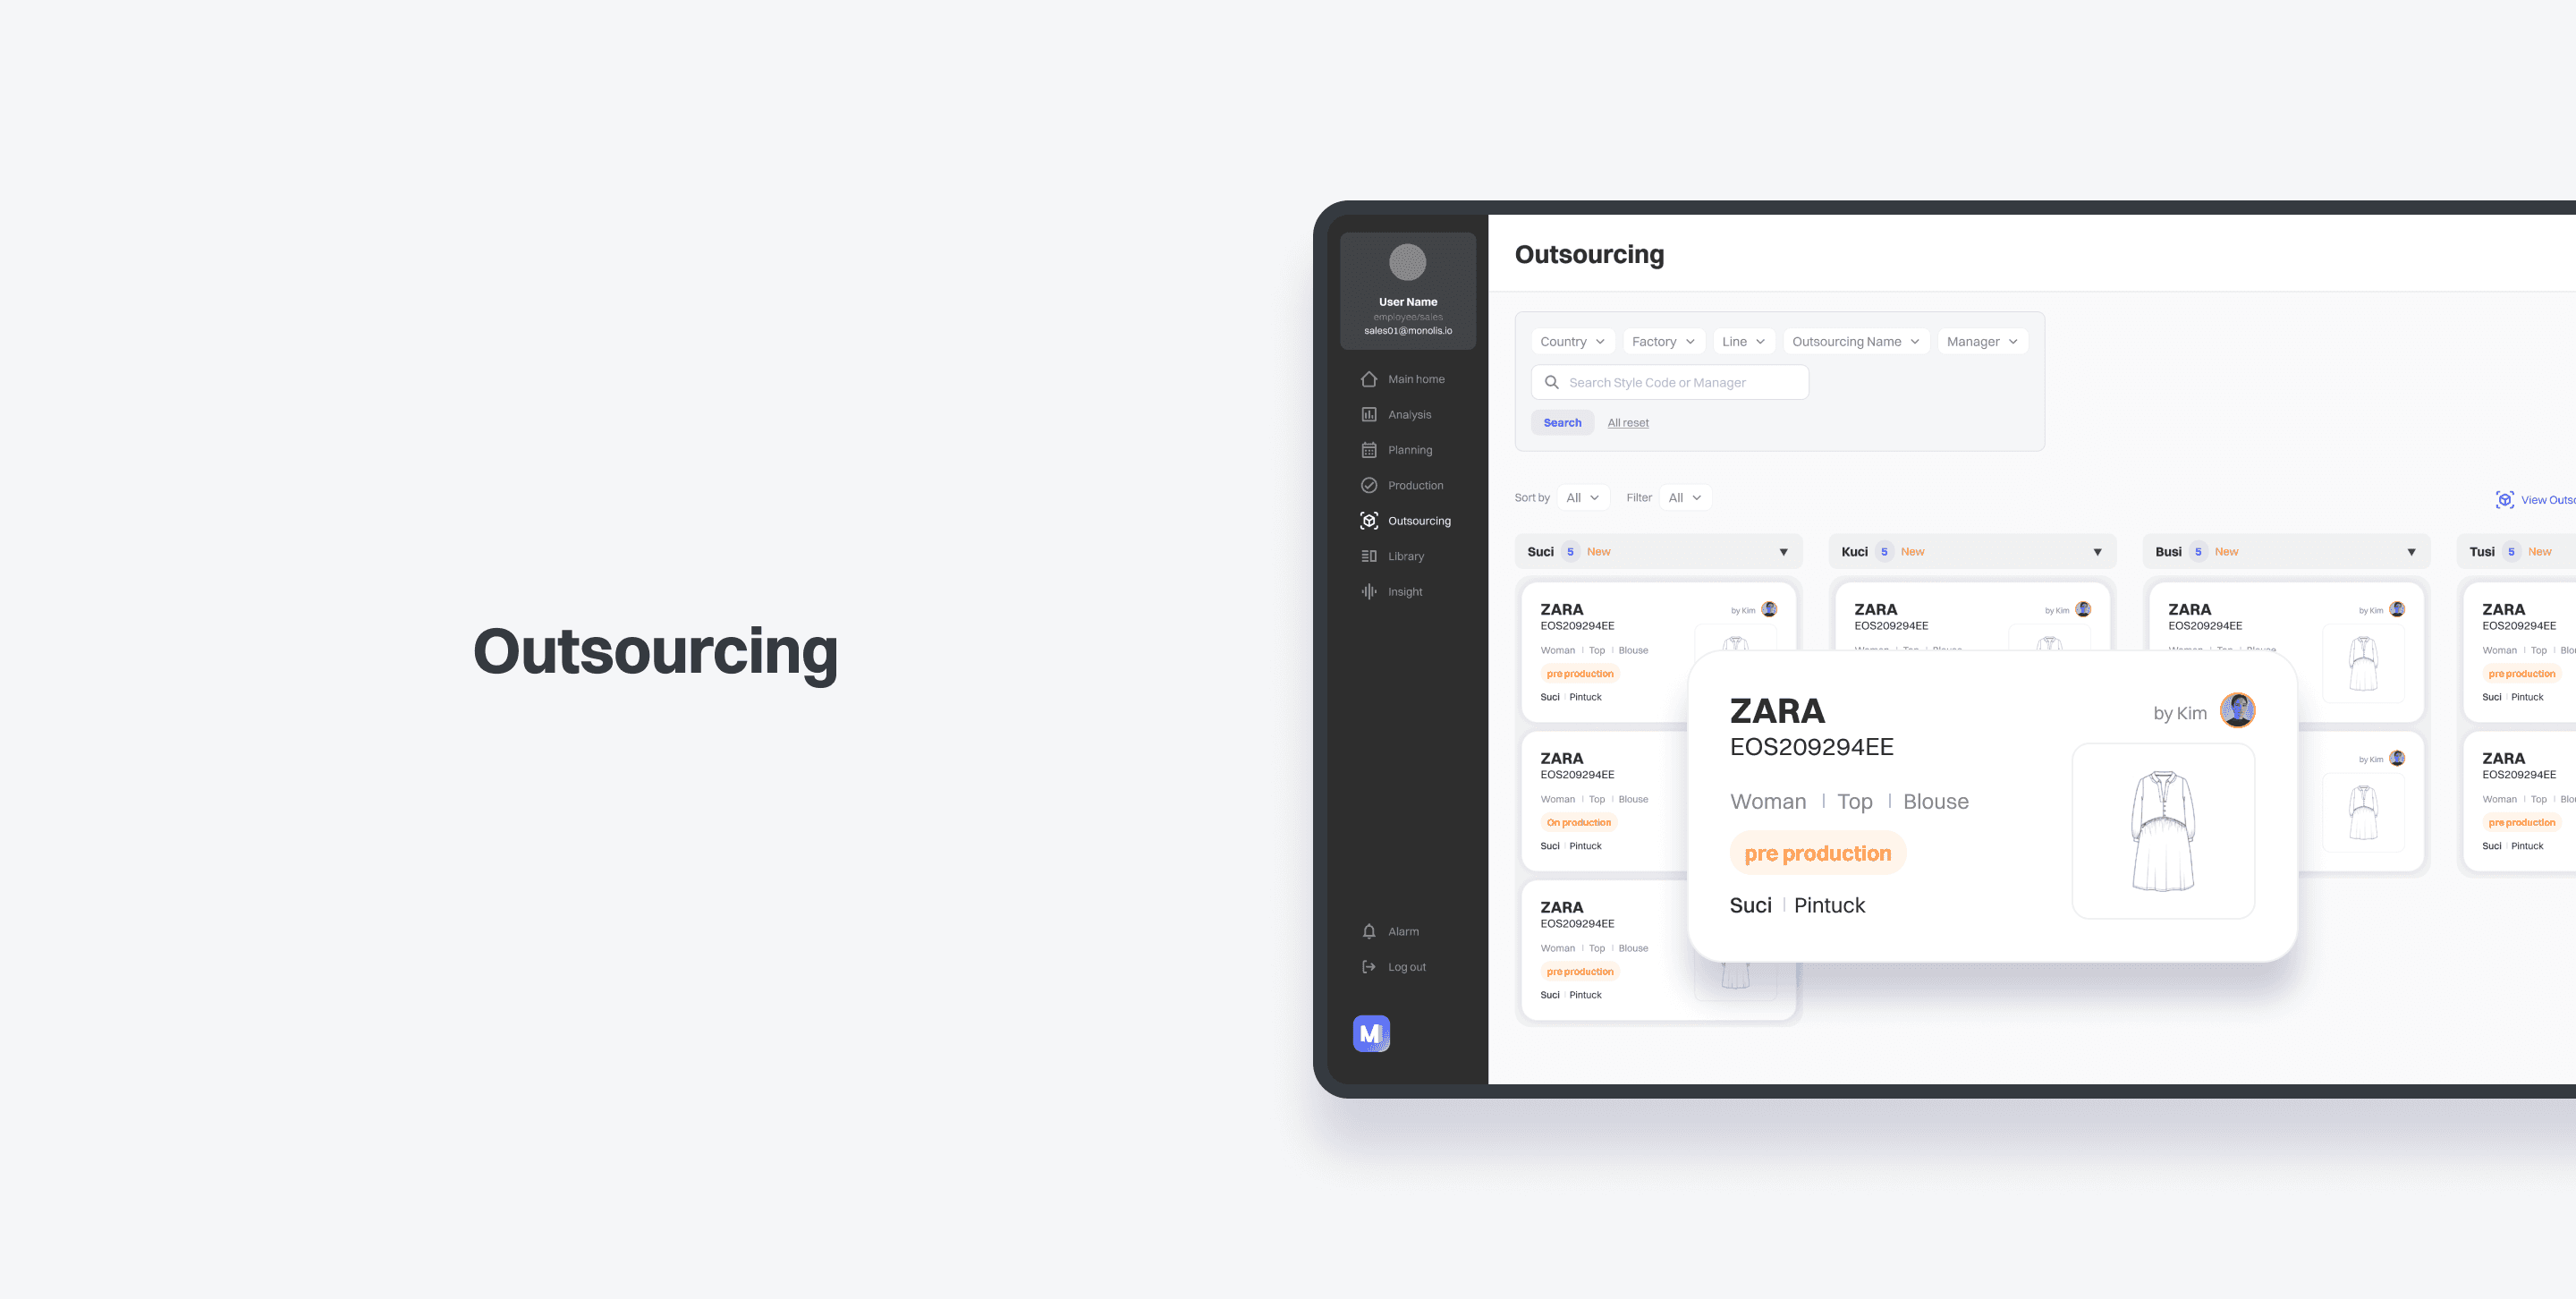
하청 업체에 따라 스타일을 분류한 페이지입니다. 페이지를 공유하여, 원청과 하청 간 협업을 진행합니다.
This is a page that categorizes styles by subcontractor. By sharing the page, the original office and the subcontractor can cooperate.

그동안 분석 및 생산 완료한 스타일이 누적되는 페이지입니다. 상세한 검색 기능을 통해 스타일 기록을 쉽게 찾습니다.
This page accumulates styles that have been analyzed and produced. Find style history easily with detailed search functions.

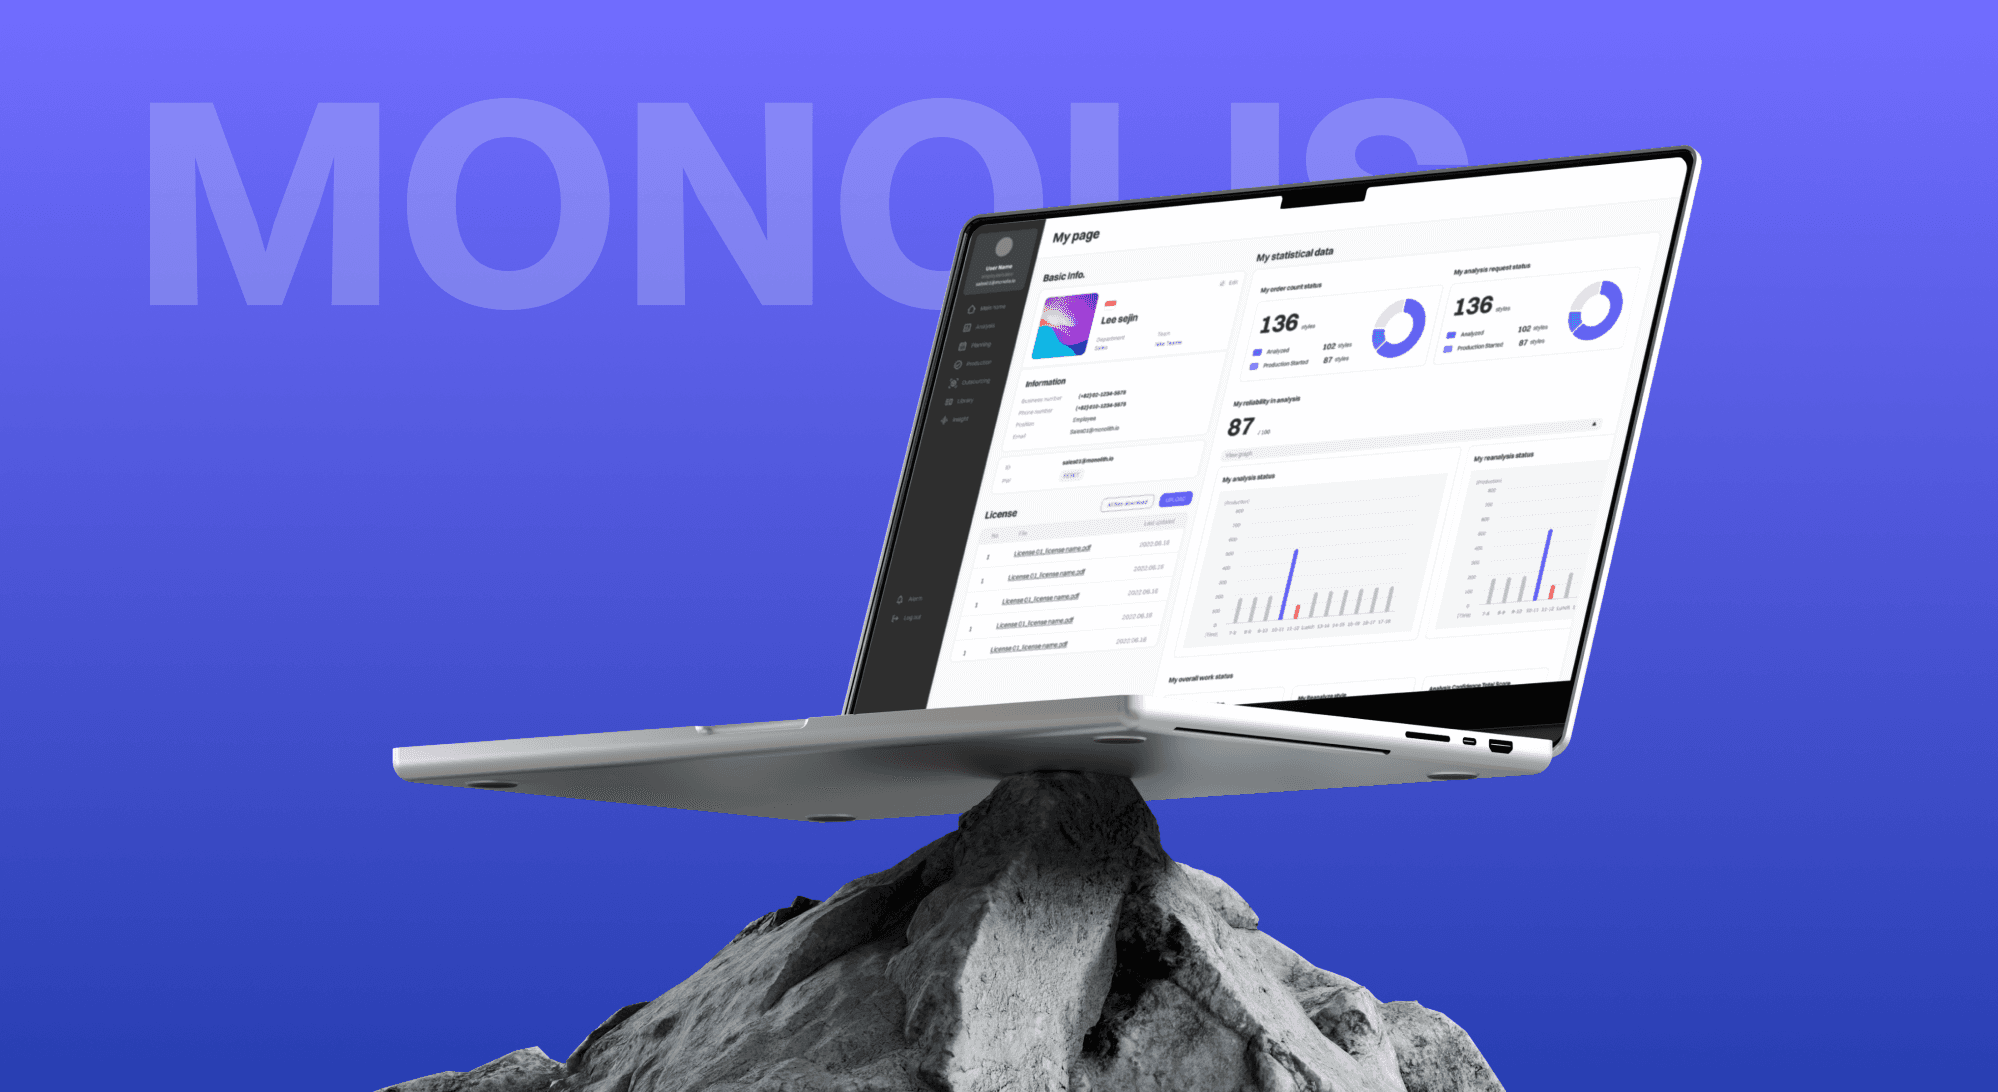
마이페이지에서 기본 정보를 수정하고 필요한 자격증을 업로드 합니다. 나만의 업무 현황도 확인할 수 있습니다.
On My Page, you can correct the default information and upload the required license. You can also check your own work status.
