BX / UXUI
|
Client
GNE
Period
2022.12-2023.02
Scope of Work
BI / UXUI
Worker
Director JANE Desiner BELLA/KEMI/WENDY


Overview
리스크웨더는 개인투자자가 금융 상품의 리스크를 모른체로 투자하는 문제를 개선하기 위해 기획한 서비스입니다. 금융공학 모델을 통해 산출되는 리스크 정보는 이해하기 어려워 기관 투자자를 비롯한 전문가 집단만이 제한적으로 활용하고 있습니다. 이에 따라 리스크웨더는 개인 투자자가 쉽고 직관적으로 리스크를 파악할 수 있도록 일기예보 컨셉을 차용하여 새로운 지표를 제작했습니다.
Riskweather is a service designed to improve the problem of individual investors investing without knowing the risks of financial products. Risk information calculated through financial engineering models is difficult to understand, so only institutional investors and other expert groups are using it on a limited basis. As a result, Riskweather created new ways to help individual investors identify risks easily and intuitivelyby borrowing the weather forecast concept.

BX Design
‘리스크’와 웨더의 특성에 맞는 BX를 개발하고 명함 / 봉투 / 우산 등의 산출물, 그리고 가이드를 제작했습니다.
로고와 더불어 컬러, 시각적 모티프를 적극적으로 활용했습니다.
We developed a BX that fits the concepts of 'risk' and weather, and produced products such as business cards, envelopes, umbrellas, etc., and guides. Along with the logo, we actively used color and visual motifs.
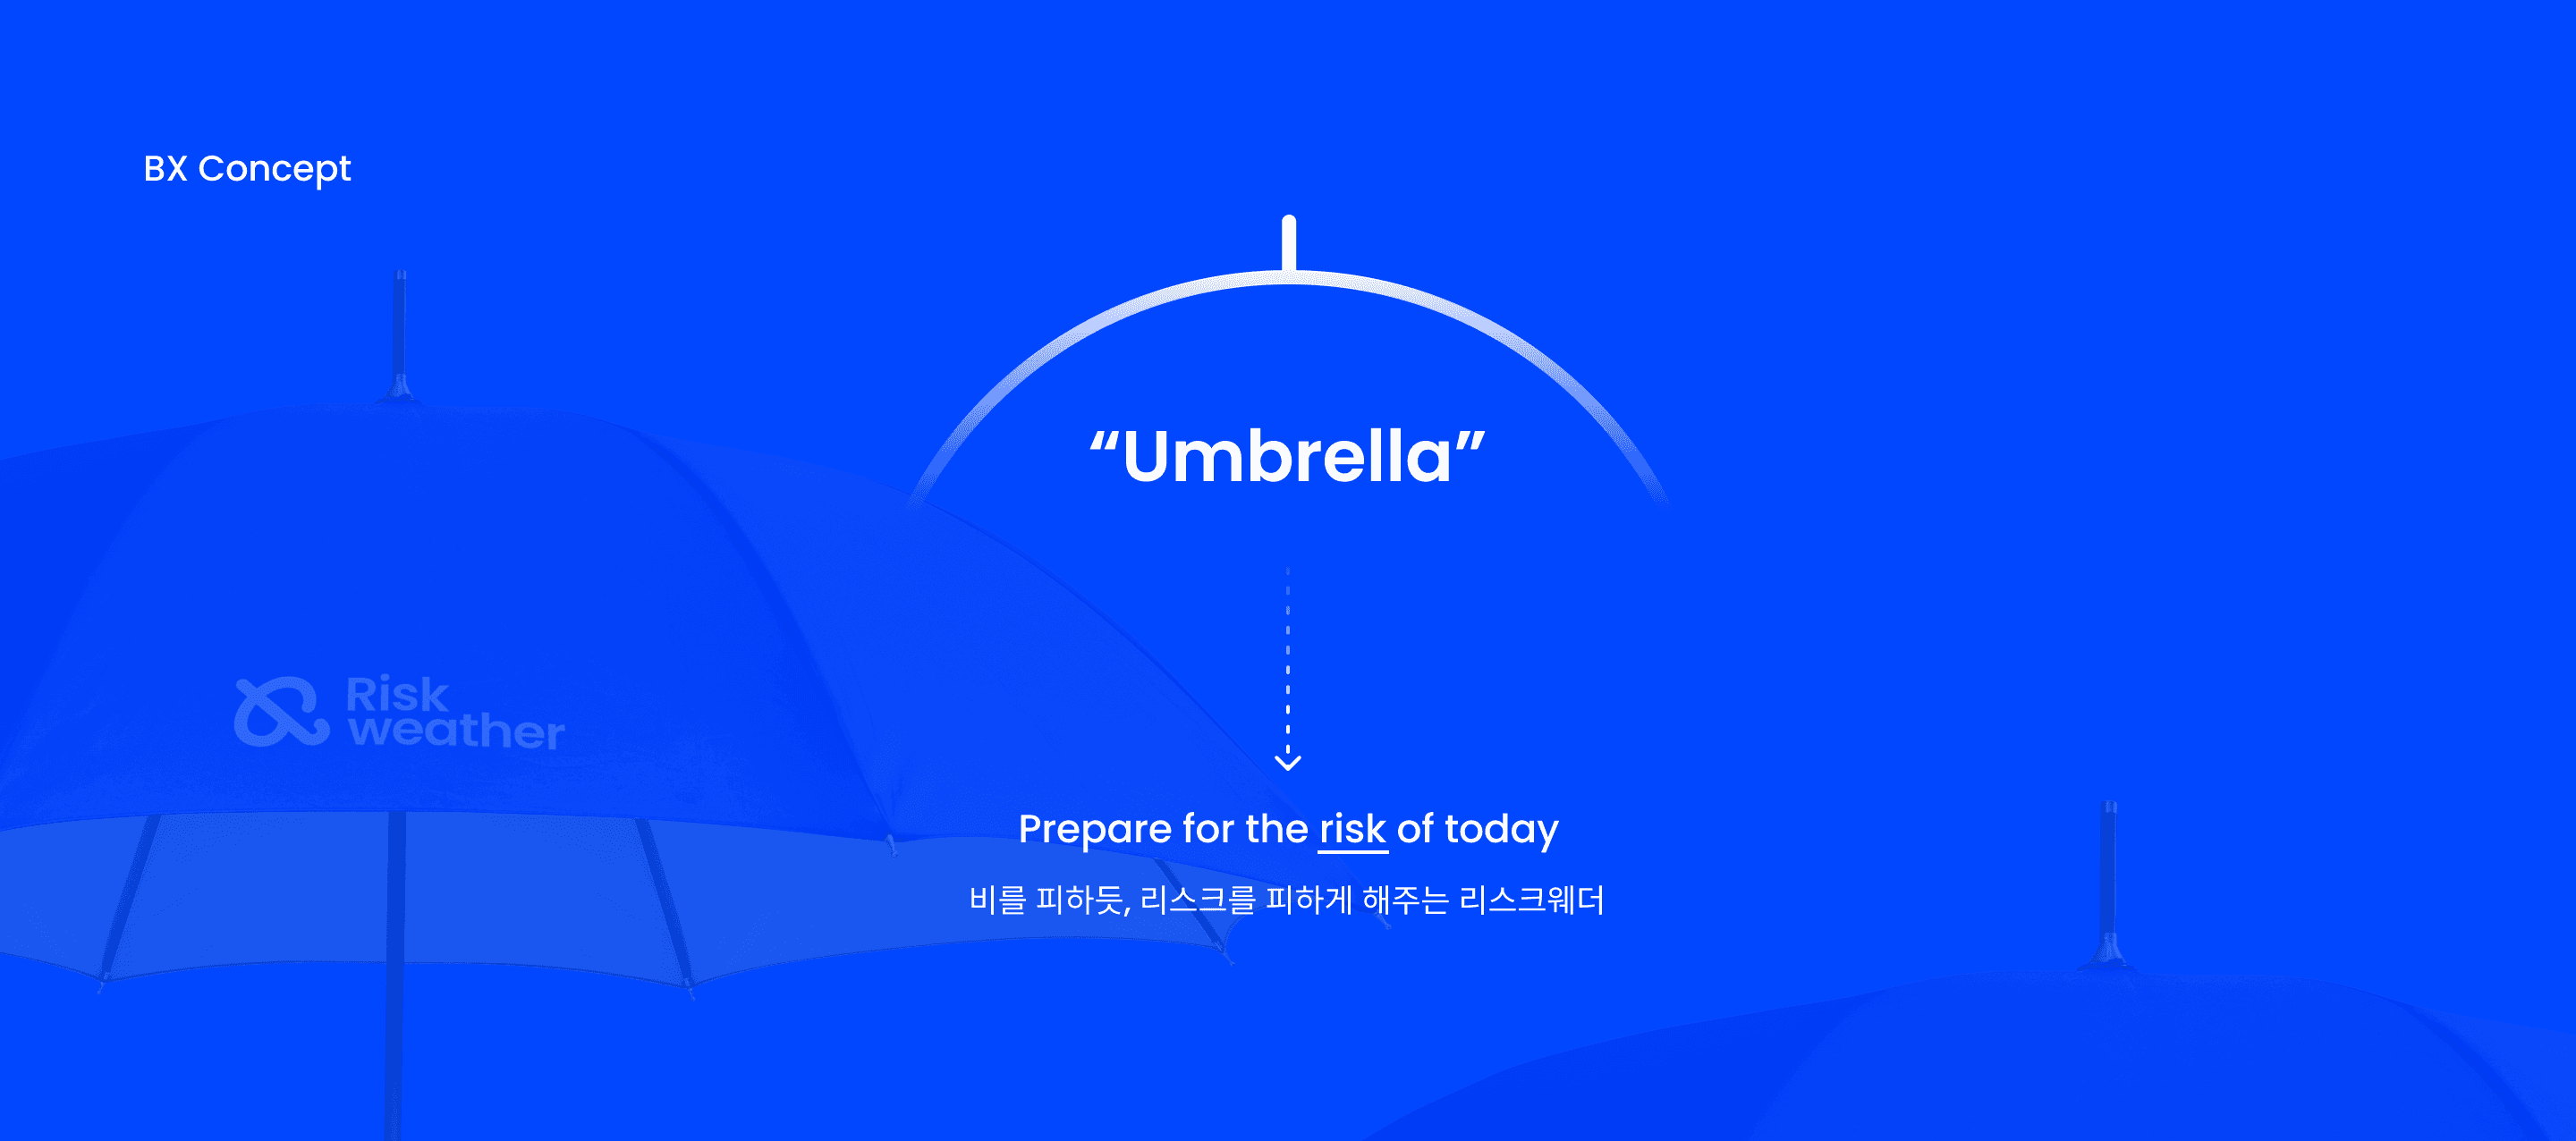
BX Design Concept
‘리스크' 와 ‘웨더'를 이어줄 수 있는 BX 심볼로서 ‘우산’을 사용했습니다. 우산은 일기예보를 본 후 미리 준비하게 되는, 비를 피하게 해주는 고마운 도구입니다. 이는 ‘리스크웨더’라는 서비스의 역할과도 부합합니다. ’비’라는 리스크를 피하기 위해 ‘우산’의 역할을 하는 리스크웨더 서비스를 이용하는 것이기 때문입니다.
We used 'umbrella' as a BX symbol that can connect the meaning of 'risk' and 'weather'. An umbrella is a useful tool that helps us avoid the rain, which we prepare in advance after looking at the weather forecast. This is also in line with the role of a service called 'riskweather'. This is because the risk weather service, which acts as an "umbrella," is used to avoid the risk just like "rain."

Logo Design
리스크웨더의 브랜드 로고에서 가장 핵심적인 의미를 담은 ‘우산'과 대문자 R을 융합해 형상화했습니다. ‘우산' 이라는 아이디어로 다양한 디자인 시안을 만든 후 조형적으로 가장 균형감있고 의미와 부합하는 것을 정했습니다.
We combined the shape of an 'umbrella' and capital R, which have the most important meaning in Riskweather's brand logo. After making various design proposals with the idea of "umbrella," we decided to on the most balanced and meaningful design.

Color
금융 서비스의 특성에 맞는 블루 컬러를 선정하여 로고 및 서비스에 포인트 컬러로 적용했습니다.
로고에는 다른 명도의 블루 컬러 2가지를 조합하여 그라디언트 색감을 표현해 자유롭고 다채로운 느낌을 첨가했습니다.
We selected a blue color that matches the tone of financial service and applied it as a point color to the logo and service. We combined two blue colors with different brightness to add a free and colorful feeling by expressing gradient colors.

Overview
리스크웨더는 비전문가를 타겟 고객으로 하는 B2C 서비스이기에 일반적인 사용자에게 높은 사용성을 제공합니다.
분석 결과는 수치 정보가 아닌 날씨 기호로 표시하여 난해함을 줄이고 직관적으로 이해할 수 있도록 제작하여 유용성을 높였습니다.
Riskweather is a B2C service that targets non-professional customers, so we try to provide high usability for those users.
The analysis results are displayed with weather symbols, not numerical information, to reduce difficulty and to be intuitively understood to increase usefulness.
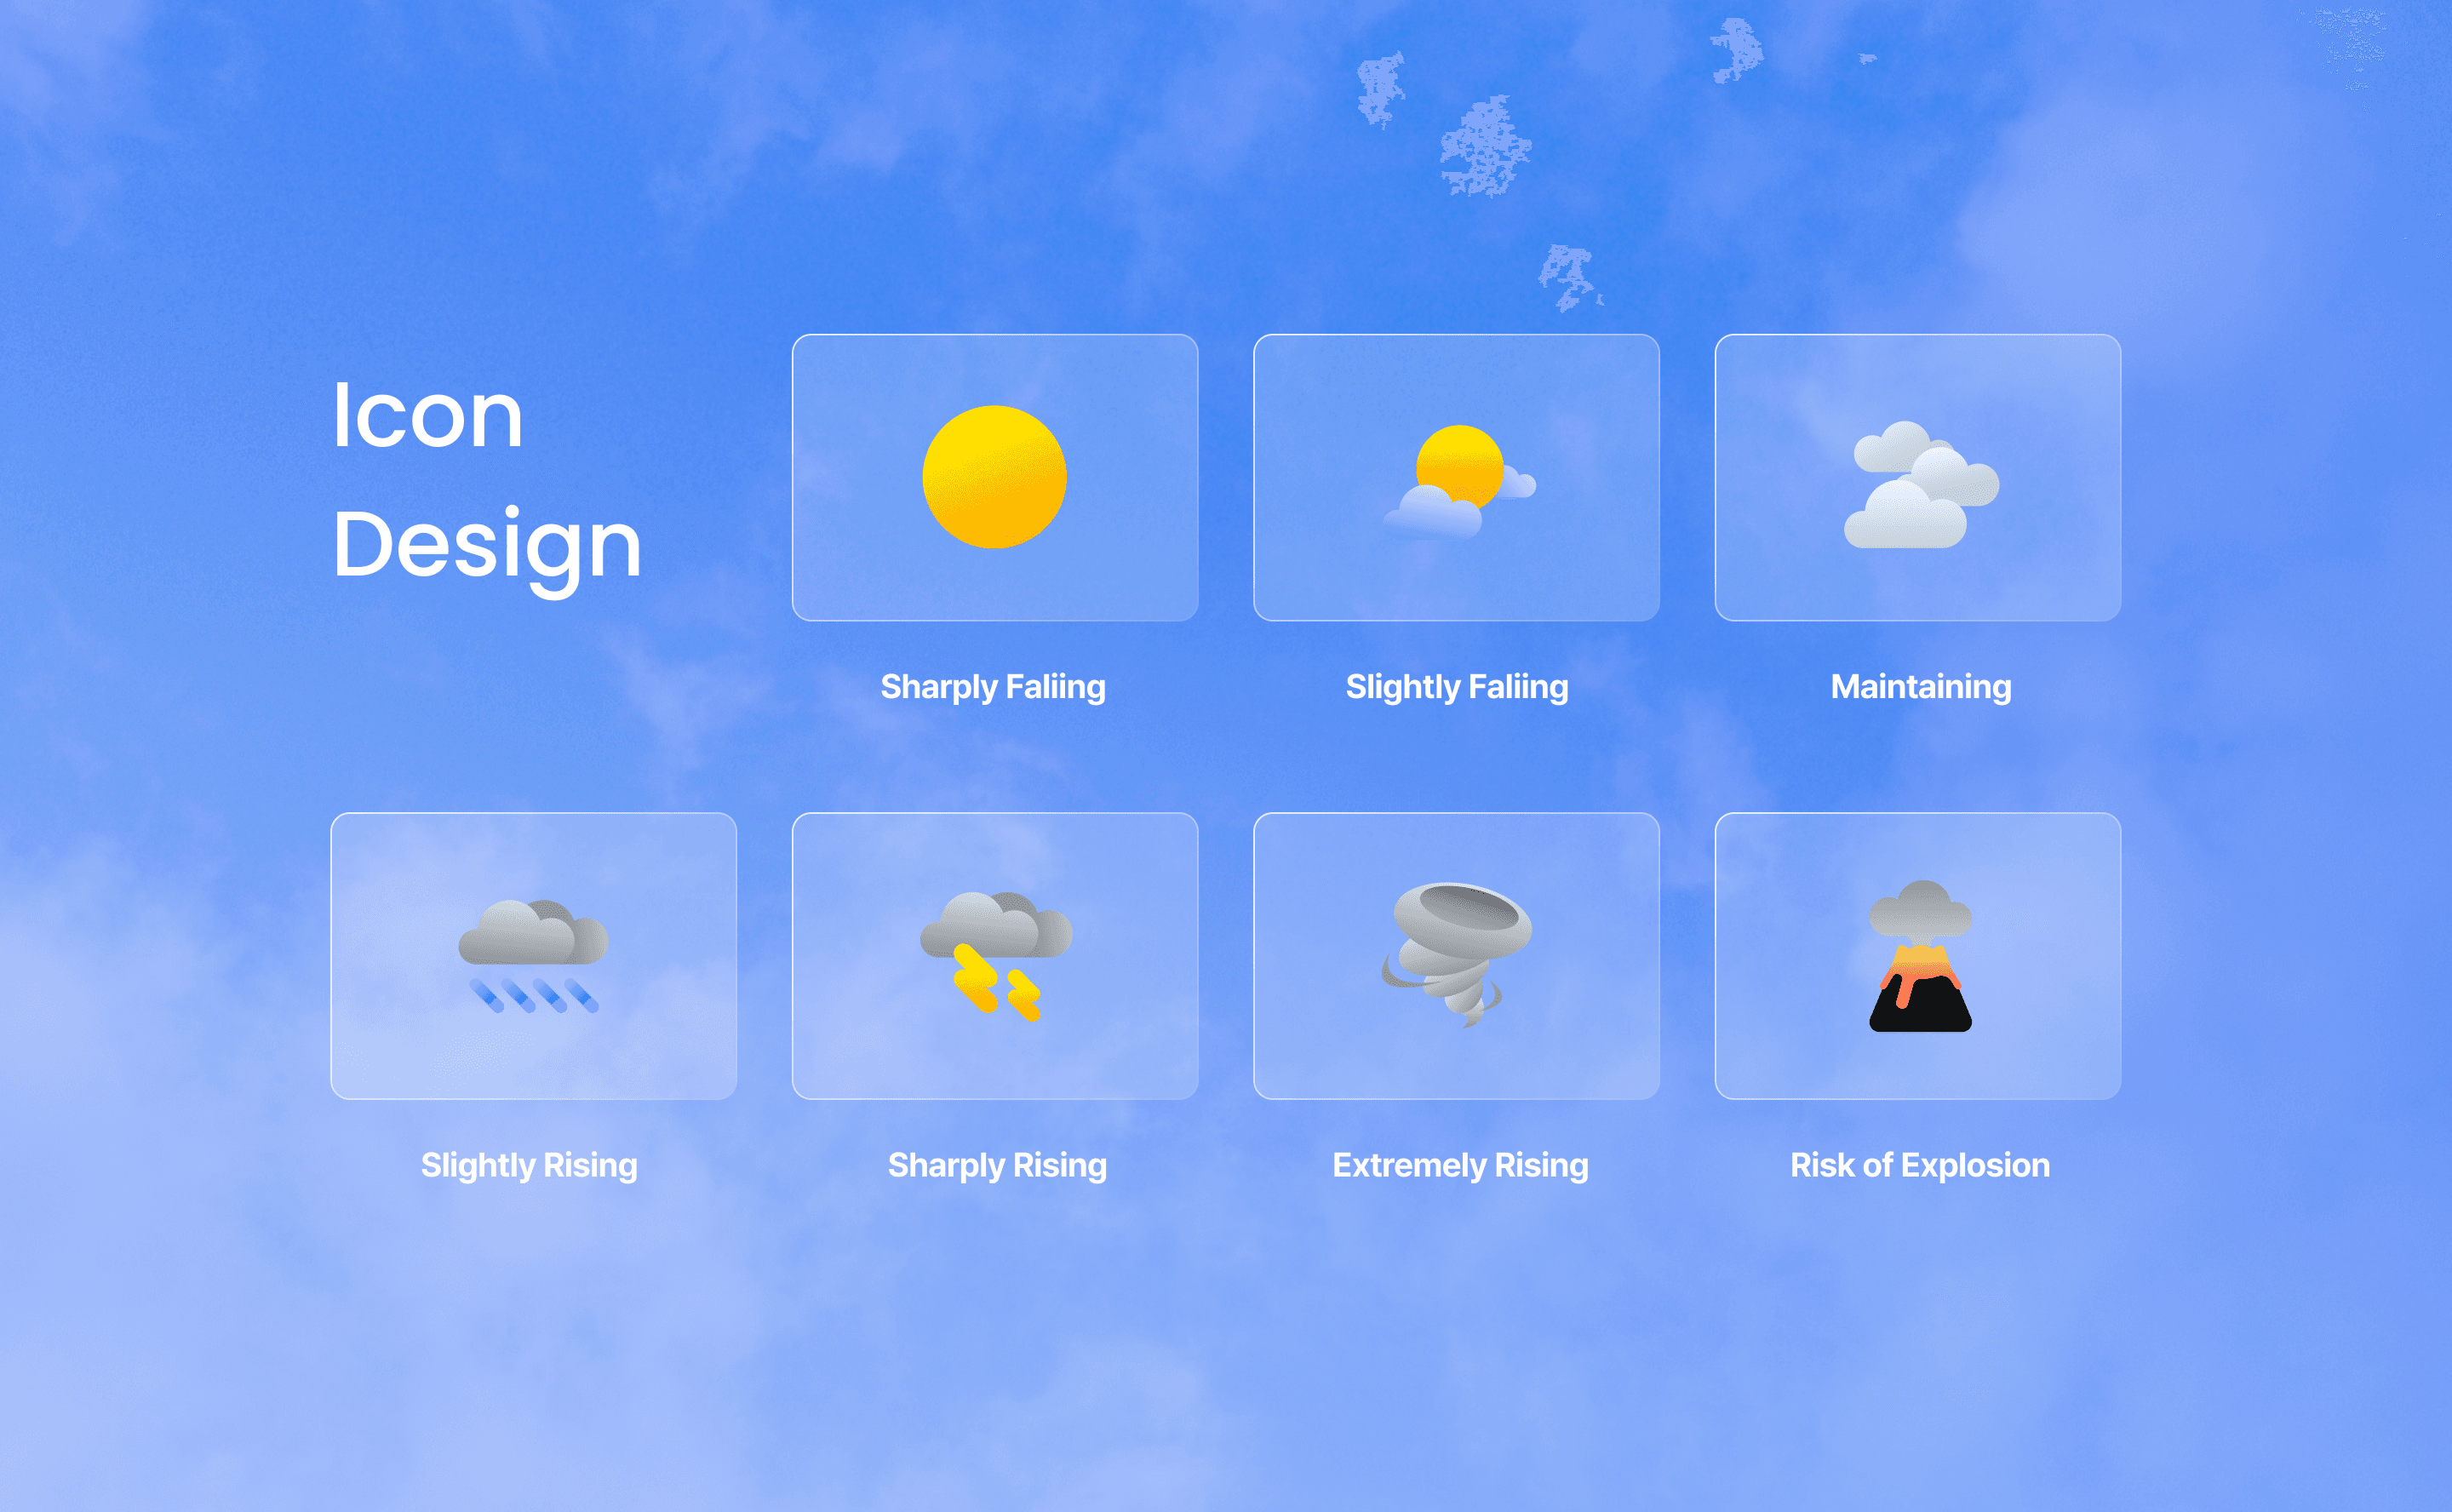
Weather Icon
리스크웨더는 금융 상품의 리스크 정보를 날씨 기호로 표시하여 난해함을 줄이고 직관적으로 이해할 수 있도록 제작하였습니다. 리스크 정보는 긍정/부정이 아닌 현상에 대한 설명이며, 의사결정시 참고 자료입니다. 날씨의 경우 명확한 긍정/부정 또는 의사결정(Do/Don’t)을 나타내는 지표가 아니면서 현상을 직관적으로 나타내는 기호를 가지고 있어 서비스에 활용하기 적합하다 판단하였습니다.
Riskweather is designed to reduce difficulty and intuitively understand the risk information of financial products by displaying them in weather symbols. Risk information is not positive or negative state, but a description of the phenomenon, and also a reference for decision making. Weather is also not an indicator of positive/negative or decision-making (Do/Don't), but it has a symbol that intuitively represents the phenomenon. So we considered wheater suitable for the concept of the service.

Main page
메인 페이지에서 투자자는 자산의 날씨 정보를 통해 현재 시장이 어떻게 변하고 있는지 파악하고 빠르게 대응할 수 있습니다. World Risk Weather 지도를 통해, 전세계의 주식과 코인 등 2000개 자산에 대한 리스크도 쉽게 찾아볼 수 있도록 구성하였습니다. 페이지 하단에서는 자산과 관련된 중요한 뉴스를 확인하고 현재 금융 시장의 동향을 살펴볼 수 있습니다.
On the main page, the assets' weather information allows investors to understand how the market is changing and respond quickly. Through the World Risk Weather map, users can easily find risks for 2,000 assets, including stocks and coins around the world. At the bottom of the page, you can see important news about assets and see current financial market trends.

Risk Chart
자산 상세페이지에서는 주간 날씨 정보와 1일 동안 발생 가능한 최대 손실인 ‘Maximum loss’ 수치를 보기 쉽게 제공하여, 해당 자산의 리스크를 직관적으로 파악할 수 있습니다.
Line과 Candle 차트 2가지 방법으로 자산을 비교해가며 리스크와 가격의 변동 사항을 편리하게 볼 수 있도록 설계하였습니다.
The Asset Detail page provides weekly weather information and the 'Maximum loss' figure(which is the maximum possible loss in a day) for users to intuitive understand the risk of the asset.
It is designed to compare assets in two ways, Line and Candle charts, to make it easier to see changes in risk and price.

Portfolio
투자자는 Crypto, Stock, Index가 함께 포함된 포트폴리오를 구성하고, 개별 자산 뿐만 아니라 포트폴리오에 대한 리스크 정보도 함께 제공받을 수 있습니다. 페이지 왼쪽에서 투자하고 있는 전체 자산에 대한 리스크를 효과적으로 관리하고, 오른쪽 목록에서 자산을 손쉽게 추가해 보세요.
Investors can form a portfolio that includes Crypto, Stock, and Index, and receive risk information about the portfolio as well as individual assets. Effectively manage the risk of the entire asset you are investing in on the left side of the page, and easily add the asset in the list on the right.
